Sorghum (Sorghum bicolor (L.) Moench) is an important essential cereal crop in Ethiopia. Conversely, its productivity is low due to numerous biotic and abiotic factors. There are diverse and dynamic environmental conditions which needs detail and continue study on genotypes by environment interaction (GEI) to develop stable genotypes. The objective of this study was to determine the magnitude of GEI for grain yield of forty two sorghum genotypes and to identify stable and high yielding genotypes across locations. The experiments were laid out at three locations for two growing seasons using alpha lattice design with three replications. The plot size 5 m x 0.75 m x 2 rows (7.5 m2) and distance between block, replication, and plot was 1m, 1.5m, and 0.75m, respectively. Phonologic, agronomic, diseases and grain yield data were collected but only grain yield was used for stability analysis. The ANOVA revealed highly significant variation (p <0.01) among sorghum genotypes across locations and seasons. Mean grain yield of genotypes ranged from 1.29 to 3.69 with mean grain yield of 2.36, while environment range from 1.18 to 3.63 t/ha. The genotype G1 showed good performance across all test sites which range 5th at E1,3rd at E3 and E4, 15th and 7th at E5 and E6 and maximum grain yield was harvested from E3. Yield data were also analyzed using the GGE (that is, G, genotype +GEI, genotypes-by- environment interaction) bi-plot method. The first two principal components (PC1 and PC2) were used to create a 2- dimensional GGE bi-plot and explained 59.67 and 13.48 % of GGE sum of squares, respectively. GGE bi- plot identified G16, G4, and G1 high yielders and stable and G34 and G25 was the lowest yielding and least stable across locations. On the other hand, the environment E6, E4 and E1 were the most suitable to select desirable genotypes.
| Published in | International Journal of Genetics and Genomics (Volume 12, Issue 2) |
| DOI | 10.11648/j.ijgg.20241202.11 |
| Page(s) | 19-30 |
| Creative Commons |
This is an Open Access article, distributed under the terms of the Creative Commons Attribution 4.0 International License (http://creativecommons.org/licenses/by/4.0/), which permits unrestricted use, distribution and reproduction in any medium or format, provided the original work is properly cited. |
| Copyright |
Copyright © The Author(s), 2024. Published by Science Publishing Group |
GEI, AMMI, Multi-environmental Trial, Stability
2.1. Description of Study Area
Environment code | Description | Altitude | Rainfall (mm) | Soil type | Ave. Temp. (ºC) | |
|---|---|---|---|---|---|---|
(m.a.s.l) | Max. | Min. | ||||
E1 | Assosa2020 | 1553 | 1291.2 | Nitisols | 28.6 | 14.6 |
E2 | Assosa2021 | 1553 | 1130 | Nitisols | 30 | - |
E3 | Bako2020 | 1650 | 1425.3 | Nitisols | 29 | 12.48 |
E4 | Bako2021 | 1650 | 1245 | Nitisols | 34 | - |
E5 | Jimma2020 | 1753 | 1639 | Nitisols | 27.6 | 9.8 |
E6 | Jimma2021 | 1753 | 1561 | Nitisols | 27.4 | 11.0 |
2.2. Experimental Materials
#G. code | Genotype | Pedigree | #G. code | Genotype | Pedigree |
|---|---|---|---|---|---|
1. | NJ003 | NJ003 | 22. | ETSL 100346 | ETSL 100346 |
2. | ETSC 300376-1 | (ETS639/SRN-39)/Adukara | 23. | ETSL 100620 | ETSL 100620 |
3. | Mok087 | Mok087 | 24. | ETSL 100644 | ETSL 100644 |
4. | Mok079 | Mok079 | 25. | ETSL 100861 | ETSL 100861 |
5. | Bmb097 | Bmb097 | 26. | ETSL 101515 | ETSL 101515 |
6. | ETSC 300373-4 | (ETS639/SRN-39)/Jorgocolle#1 | 27. | PML981442 | PML981442 |
7. | Bmb102 | Bmb102 | 28. | PML981446 | PML981446 |
8. | Ba119 | Ba119 | 29. | PML981475 | PML981475 |
9. | Man069 | Man069 | 30. | PML981488 | PML981488 |
10. | Sl081 | Sl081 | 31. | BTx378 | BTx378 |
11. | ETSC 300382-1 | (ETS639/SRN-39)/Jorgocolle#1 | 32. | ETSL101699 | ETSL101699 |
12. | Bam075 | Bam075 | 33. | 13MW6029 | 13MW6029 |
13. | Mok085 | Mok085 | 34. | 13MW6042 | 13MW6042 |
14. | Bmb095 | Bmb095 | 35. | ETSC10022-44-2 | ETSC10022-44-2 |
15. | Boj007 | Boj007 | 36. | 07MW6002 | 07MW6002 |
16. | Ba066 | Ba066 | 37. | ETSC10022-40 | ETSC10022-40 |
17. | Bs082 | Bs082 | 38. | ETSC10020-22-1 | ETSC10020-22-1 |
18. | Y047 | Y047 | 39. | ETSC120051-3 | ETSC120051-3 |
19. | Qon070 | Qon070 | 40. | ETSC12004-11 | ETSC12004-11 |
20. | Qon072 | Qon072 | 41. | Assosa-1 | Bambasi-9 |
21. | ETSL 100124 | ETSL 100124 | 42. | Bonsa | 97BK6129/85MW4138 |
2.3. Experimental Design and Field Management
2.4. Data Collection
2.5. Statistical Analysis
2.5.1. Analysis of Variance
2.5.2. GGE Bi-plot Analysis
3.1. Mean Performance of Sorghum Genotypes Across Tested Locations
Genotype | Assosa2020 (E1) | Assosa2021 (E2) | Bako2020 (E3) | Bako2021 (E4) | Jima2020 (E5) | Jima2021 (E6) | Mean | Rank |
|---|---|---|---|---|---|---|---|---|
G1 | 4.59d | 2.38a | 4.99 b | 4.33 a | 1.89d-f | 3.88f | 3.69 | 1 |
G2 | 3.35q | 0.89k-m | 4.98 b | 2.05kl | 1.23h-k | 1.40tu | 2.15 | 19 |
G3 | 3.91h-j | 2.13ab | 3.97 d-i | 3.07ef | 2.18b-e | 3.72g | 3.17 | 6 |
G4 | 5.05b | 0.70l-n | 4.90b | 3.03fg | 2.89a | 4.75d | 3.55 | 2 |
G5 | 3.53n-p | 1.3 f-j | 4.35cd | 2.77h | 2.52ab | 3.46h | 3.01 | 8 |
G6 | 3.39pq | 1.96bc | 3.54 h-n | 2.42j | 1.40gh | 1.73p | 2.41 | 14 |
G7 | 3.79j-l | 1.65c-g | 3.59h-n | 1.38qr | 2.45b-e | 2.78kl | 2.57 | 11 |
G8 | 3.92h-j | 2.40a | 3.89e-j | 2.12 kl | 1.91d-f | 2.06n | 2.72 | 10 |
G9 | 2.97r | 1.50 d-i | 4.29c-e | 2.93 f-h | 1.91d-f | 1.37uv | 2.47 | 12 |
G10 | 5.45a | 0.65l-o | 4.08d-g | 4.21a | 1.47gh | 3.19i | 3.17 | 6 |
G11 | 3.72k-m | 1.58c-h | 1.77v | 1.46pq | 2.46bc | 3.00j | 2.34 | 15 |
G12 | 3.58m-o | 1.78b-e | 3.85f-k | 3.24de | 2.43bc | 5.18b | 3.34 | 5 |
G13 | 4.14ef | 1.70c-f | 2.96p-s | 3.94b | 2.32b-d | 5.80a | 3.48 | 3 |
G14 | 3.62mn | 2.39a | 3.46 j-o | 4.32a | 2.09c-f | 5.00c | 3.48 | 3 |
G15 | 4.15ef | 1.17i-k | 3.59h-n | 2.51j | 2.89a | 2.54m | 2.80 | 8 |
G16 | 5.05b | 1.45e-i | 4.61bc | 2.89gh | 2.09c-f | 4.39e | 3.41 | 4 |
G17 | 4.16e | 1.23g-k | 4.80 b | 3.34 cd | 1.47gh | 3.38h | 3.07 | 7 |
G18 | 3.56no | 1.75 b-e | 3.85f-k | 2.01 lm | 2.38bc | 2.81k | 2.73 | 9 |
G19 | 2.56u | 1.89bc | 2.48tu | 2.21 k | 1.69fg | 2.67lm | 2.25 | 16 |
G20 | 3.86i-k | 1.92bc | 4.67bc | 1.31qr | 2.45bc | 4.28e | 3.07 | 7 |
G21 | 2.62tu | 1.11i-j | 2.76r-u | 0.77s | 0.84k-n | 1.86o | 1.66 | 29 |
G22 | 2.72st | 0.45n-s | 3.52i-o | 1.77no | 0.98i-m | 1.48s-u | 1.83 | 25 |
G23 | 3.45o-q | 0.13s | 3.86f-k | 1.86mn | 0.46no | 1.53r-t | 1.87 | 23 |
G24 | 2.87rs | 0.15rs | 3.38l-p | 1.25 r | 0.76o | 1.21w | 1.61 | 32 |
G25 | 2.12vw | 0.48n-s | 3.67g-n | 0.85s | 0.38o | 1.14w | 1.44 | 34 |
G26 | 4.09e-g | 0.6l-q | 3.64g-n | 2.19k | 0.99i-m | 1.66pq | 2.19 | 17 |
G27 | 1.96w-y | 1.96bc | 3.87e-k | 0.85s | 0.90k-m | 1.58q-s | 1.86 | 24 |
G28 | 3.66l-n | 0.27o-s | 3.56h-n | 1.76no | 0.92k-m | 0.66xy | 1.81 | 27 |
G29 | 1.99v-y | 1.93bc | 4.27c-f | 1.84n | 1.34g-j | 0.79x | 2.04 | 21 |
G30 | 1.80z | 0.98 j-l | 3.80g-l | 3.07ef | 0.69 n-o | 0.35B | 1.78 | 28 |
G31 | 3.94g-j | 0.53 m-r | 3.97d-h | 3.48c | 0.99i-m | 1.68pq | 2.42 | 13 |
G32 | 1.87yz | 1.87 b-d | 3.61h-n | 0.84s | 0.38o | 1.26vw | 1.64 | 30 |
G33 | 2.07v-x | 0.22 p-s | 3.25n-q | 1.36qr | 0.91k-m | 0.33B | 1.37 | 35 |
G34 | 1.93x-z | 0.49 n-s | 3.43k-o | 0.48t | 0.99i-m | 0.46AB | 1.29 | 36 |
G35 | 4.06e-h | 0.61 l-p | 2.37u | 3.49c | 0.77l-o | 1.74op | 2.17 | 18 |
G36 | 2.74st | 0.37 n-s | 2.52s-u | 2.59ij | 0.90k-m | 0.61yz | 1.62 | 31 |
G37 | 3.99 f-i | 0.67 l-n | 3.70g-m | 1.63op | 1.23h-k | 1.39uv | 2.09 | 20 |
G38 | 3.02r | 0.24p-s | 3.34m-q | 2.76 hi | 1.36g-i | 1.46s-u | 2.03 | 22 |
G39 | 1.31 A | 1.61c-h | 2.79r-u | 2.55 j | 0.93j-m | 1.64p-r | 1.82 | 26 |
G40 | 2.49 u | 1.23h-j | 2.91q-t | 2.84h | 1.11h-l | 1.52r-t | 2.03 | 22 |
G41 | 4.82 c | 0.68l-n | 3.08 o-r | 1.46pq | 1.34g-j | 1.65p-r | 2.17 | 18 |
G42 | 2.14v | 0.21q-s | 3.69 g-n | 1.40qr | 1.06h-m | 0.49zA | 1.51 | 33 |
Mean | 3.33 | 1.18 | 3.63 | 2.30 | 1.48 | 2.24 | 2.36 | |
CV (%) | 3.2 | 9.9 | 7.7 | 4.8 | 7.9 | 3.9 | ||
LSD at 5% | 0.17 | 0.19 | 0.46 | 0.18 | 0.19 | 0.14 |
3.2. Combined Analysis of Variance Over Locations
Source of variation | Df | SS | %SS | MS |
|---|---|---|---|---|
Genotypes | 41 | 342.99 | 24.84 | 8.36*** |
Location (Loc) | 2 | 158.75 | 11.49 | 79.37*** |
Years (Yr) | 1 | 156.51 | 11.34 | 156.51*** |
Gen x Loc | 82 | 122.73 | 8.89 | 1.49*** |
Gen x Yr | 41 | 72.87 | 5.28 | 1.78*** |
Gen x Loc x Yr | 82 | 148.56 | 10.76 | 1.81*** |
Residuals | 496 | 93.04 | 6.74 | |
Total | 755 | 1382.08 | ||
Mean= 2.36 | CV =18.35 | R2=93 |
3.3. Genotype Main Effect and Genotype-by-Environment Interaction (GGE) Bi-plot Analysis
3.3.1. Ranking of Varieties Based on Mean Grain Yield and Stability Performance
3.3.2. Evaluation of Varieties Based on the Ideal Genotype
3.3.3. Evaluation of Environments Relative to Ideal Environments
3.3.4. The Polygon View of the GGE Bi-plot (The “Which-Won-Where” Patterns)
| [1] | Poehlman, J. M. and D. A. Sleper, 1995. Breeding Field Crops. 4thed, Iowa State University Press, Ames, Iowa. pp. 494. |
| [2] | Paterson, A. H., Bowers, J. E., Bruggmann, R., Dubchak, I., Grimwood, J., Gundlach, H., Haberer, G., Hellsten, U., Mitros, T., Poliakov, A. and Schmutz, J., 2009. The Sorghum bicolor genome and the diversification of grasses. Nature, 457(7229), pp. 551-556. |
| [3] | Doggett, H. 1988. Sorghum. 2nd edition. Longman Scientific and Technical, London. |
| [4] | Stemler, A. B. L., J. R. Harlan, and J. M. J. de Wet. 1977. The Sorghums of Ethiopia. Springer on behalf of New York Botanical Garden Press. 31(4), pp. 446-460. |
| [5] | Habte, N., Girma, G., Mekonen, M., Tirfessa, A., Seyoum, A., Bejiga, T., Birhanu, C., Dessalegn, K., Senbetay, T., Ayana, G., Tesso, T., Ejeta, G., Mengiste, T. 2021. Genome-wide association analysis reveals seed protein loci as determinants of variations in grain mold resistance in sorghum. TheorAppl Genet. 134(4): pp. 1167-1184. |
| [6] | Mesfin A., 2016. Assessment of Striga infestation and Evaluation of sorghum landraces for Resistance/Tolerance to [Strigahermonthica (Del.) Benth] in North-Western Ethiopia. Haramaya University, Dire Dawa, Ethiopia. |
| [7] | McGuire, S. J. 2007. Vulnerability in farmer seed Systems: Farmer practices for coping with seed insecurity for sorghum in Eastern Ethiopia. Economic Botany 61(3), pp. 211-222. |
| [8] | Adugna, A., 2014. Analysis of in situ diversity and population structure in Ethiopian cultivated Sorghum bicolor (L.) landraces using phenotypic traits and SSR markers. SpringerPlus, 3(1), pp. 1-14. |
| [9] | Ethiopian Institute of Agricultural Research (EIAR). 2019. Sorghum Breeding Manual. |
| [10] | USDA World Agricultural Production U.S. Department of Agriculture, March (2022). Foreign Agricultural Service / Global Market Analysis International Production Assessment Division (IPAD). |
| [11] | USDA World Agricultural Production U.S. Department of Agriculture, (2023). Foreign Agricultural Service / Global Market Analysis International Production Assessment Division (IPAD). |
| [12] | Adugna, A., Tesso, T., Deressa, A., 2005. Sorghum production and research experiences in Ethiopia: a production manual, Ethiopian Agricultural Research Organization, Addis Ababa, Ethiopia. pp 31. |
| [13] | Ethiopian Institute of Agricultural Research (EIAR) 2014. Ethiopian strategy for sorghum 2014-2024, Pp 1-10. |
| [14] | FAO (Food and Agriculture Organization of the United Nations) (2020). Available from: |
| [15] | Teressa, T., Bejiga, T., Semahegn, Z., Seyoum, A., Kinfe, H., Nega, A., Ayele, L., Nadew, D., Salah, M., Siraw, S. and Bekele, M., 2021. Evaluation of advanced sorghum (Sorghum bicolor L. Moench) hybrid genotypes for grain yield in moisture stressed areas of Ethiopia. Journal of agricultural science and food technology, 7(2), pp. 212-219. |
| [16] | Van Eeuwijk, F. A., Bustos-Kortsa, D. V. and Malosetti, M. 2016. What Should Students in Plant Breeding Know About the Statistical Aspects of Genotype × Environment Interactions? Crop Science 56(5), pp. 2119-2140. |
| [17] | Amare, S., Amare, N., Kedanemaryam, W., Taye, T., Diriba, T., Alemu, T., Habte, N., Adane, G., Sewmehone, S., Tsegaye, G., Chalachew, E., Hailemariam, S., Tamirat, B., Tokuma, L., David, J., Emma, M., Daniel, N., Ligaba, A. and Meron, B. 2020. Multi Environment and Spatial Analysis of Early Maturing Sorghum [Sorghum bicolor (L.) Moench] Genotypes in Dry Lowland Areas of Ethiopia. African Journal of Agricultural Research, 15(2), pp. 278-290. |
| [18] | Habte, N., Seyoum, A. and Gebreyohannes, A. 2016. Evaluation of Yield Performance of Intermediate Altitude Sorghum (Sorghum bicolor (L.) Moench) Genotypes Using Genotype × Environment Interaction Analysis and GGE Biplot in Ethiopia. International Journal of Trend in Research and Development, 3(2), pp. 27-35. |
| [19] | Gauch, H. and Zobel, R. W., 1997. Identifying mega-environments and targeting genotypes. Crop Science, 37(2), pp. 311-326. |
| [20] | Bänziger, M. and Diallo, A. O. 2004. Progress in developing drought and N stress tolerant maize cultivars for eastern and southern Africa. In: Friesen, D. K. and Palmer, A. F. E. (Eds.). Integrated Approaches to Higher Maize Productivity in the New Millennium. Proceedings of the 7th Eastern and Southern Africa Regional Maize Conference. CIMMYT/KARI, Nairobi, Kenya. pp. 189-194. |
| [21] | Yan and Tinker, 2006. Biplot analysis of multi-environment trial data: Principles and applications. Canadian J. Plant Sci, Pp 623-645. |
| [22] | Parfitt. R. C. 2000. Genotype x Environment Interaction among Secondary Variety Trials in the Northern Region of the South African Sugar Industry, Proc S AfrSugTechnol Ass. |
| [23] | Yan W. 2001. GGE biplot-A Windows application for graphical analysis of multi-environment trial data and other types of two-way data. Agronomy Journal 93: 1111-1118. |
| [24] | Yan W, and Kang M. 2003. GGE biplot analysis: a graphical tool for breeders, geneticists and agronomist. CRC Press, Boca Raton, FL. |
| [25] | Gomez, K. A. and Gomez, A. A., 1984. Statistical procedures for agricultural research. John wiley&sons. Toronto, Canada. 58(4), Pp. 1029-1034. |
| [26] | Gabriel, R. 1971. The bi-plot graphic display of matrices with application to principal component analysis. Biometrika, 58(3), pp. 453-467. |
| [27] | Yan, W., Hunt, L. A., Sheng, Q. and Szlavnics, Z. 2000. Cultivar evaluation and mega environment investigation based on the GGE bi-plot. Crop Sci. 40(3), pp. 597-605. |
| [28] | Adugna, A., 2007. Assessment of yield stability in sorghum. African Crop Science Journal, 15(2), pp. 83–92. |
| [29] | Yan, W., Kang, M. S., Baoluo, M., Woods, S. and Cornelius, P. L. 2007. GGE Bi-plot vs. AMMI analysis of genotype-by-environment data. Crop Sci. 47(2), pp 643-655. |
| [30] | Gebeyehu, C., Bulti, T., Dagnachew, L. and Kebede, D., 2019. Additive main effect and multiplicative interactions (AMMI) and regression analysis in sorghum [Sorghum bicolor (L). Moench] varieties. Journal of Applied Biosciences, 136, pp. 13877-13886. |
| [31] | Tegegn B, B., 2019 Genotype x Environment Interaction and Grain Yield Stability of Tef (Eragrostistef (Zucc.) Trotter) Varieties in South and South Western Ethiopia MSc Thesis. |
| [32] | Belay, F., Mekbib, F. and Tadesse, T., 2020. Genotype by environment interaction and grain yield stability of Striga resistant sorghum [Sorghum bicolor (L.) Moench] genotypes in Ethiopia. Ethiopian Journal of Crop Science, 8(2). |
| [33] | Yan, W. and Rajcan, I. 2002. Biplot analysis of test sites and trait relations of soybean in Ontario. Crop Science. 42(1), pp. 11–20. |
| [34] | Alidu Haruna, Gloria Boakyewaa Adu, Samuel Saaka Buah, Roger A. L. Kanton, Amegbor Isaac Kudzo, Abdulai Mashark Seidu & Obeng-Antwi Kwadwo | (2017) Analysis of genotype by environment interaction for grain yield of intermediate maturing drought tolerant top-cross maize hybrids under rain-fed conditions, Cogent Food & Agriculture, 3(1). |
| [35] | Yan, W. and Tinker, N. A. (2005) An Integrated Biplot Analysis System for Displaying, Interpreting, and Exploring Genotype × Environment Interaction. Crop Science, 45, pp. 1004-1016. |
| [36] | Hussein, M. A., Bjornstad, A. and Aastveit, A. H. 2000. Sasg x Estab A SAS program for computing genotype x environment stability statistics. Agronomy Journal Madison, 92(3), pp. 454-459. |
| [37] | Badu-Apraku, B., Yallou, C. G., Obeng-Antwi, K., Alidu, H., Talabi, A. O., Annor, B., Oyekunle, M., Akaogu, I. C. and Aderounmu, M., 2017. Yield gains in extra-early maize cultivars of three breeding eras under multiple environments. Agronomy Journal, 109(2), pp. 418-431. |
APA Style
Bedru, N., Matiwos, T., Birhan, T., Belete, T. (2024). Performance Evaluation of Different Sorghum Genotypes (Sorghum bicolour (L.) Moench) Using GGE Bi-plot Stability Analysis. International Journal of Genetics and Genomics, 12(2), 19-30. https://doi.org/10.11648/j.ijgg.20241202.11
ACS Style
Bedru, N.; Matiwos, T.; Birhan, T.; Belete, T. Performance Evaluation of Different Sorghum Genotypes (Sorghum bicolour (L.) Moench) Using GGE Bi-plot Stability Analysis. Int. J. Genet. Genomics 2024, 12(2), 19-30. doi: 10.11648/j.ijgg.20241202.11
AMA Style
Bedru N, Matiwos T, Birhan T, Belete T. Performance Evaluation of Different Sorghum Genotypes (Sorghum bicolour (L.) Moench) Using GGE Bi-plot Stability Analysis. Int J Genet Genomics. 2024;12(2):19-30. doi: 10.11648/j.ijgg.20241202.11
@article{10.11648/j.ijgg.20241202.11,
  author = {Nesrya Bedru and Temesgen Matiwos and Techale Birhan and Tegegn Belete},
  title = {Performance Evaluation of Different Sorghum Genotypes (Sorghum bicolour (L.) Moench) Using GGE Bi-plot Stability Analysis
},
  journal = {International Journal of Genetics and Genomics},
  volume = {12},
  number = {2},
  pages = {19-30},
  doi = {10.11648/j.ijgg.20241202.11},
  url = {https://doi.org/10.11648/j.ijgg.20241202.11},
  eprint = {https://article.sciencepublishinggroup.com/pdf/10.11648.j.ijgg.20241202.11},
  abstract = {Sorghum (Sorghum bicolor (L.) Moench) is an important essential cereal crop in Ethiopia. Conversely, its productivity is low due to numerous biotic and abiotic factors. There are diverse and dynamic environmental conditions which needs detail and continue study on genotypes by environment interaction (GEI) to develop stable genotypes. The objective of this study was to determine the magnitude of GEI for grain yield of forty two sorghum genotypes and to identify stable and high yielding genotypes across locations. The experiments were laid out at three locations for two growing seasons using alpha lattice design with three replications. The plot size 5 m x 0.75 m x 2 rows (7.5 m2) and distance between block, replication, and plot was 1m, 1.5m, and 0.75m, respectively. Phonologic, agronomic, diseases and grain yield data were collected but only grain yield was used for stability analysis. The ANOVA revealed highly significant variation (p th at E1,3rd at E3 and E4, 15th and 7th at E5 and E6 and maximum grain yield was harvested from E3. Yield data were also analyzed using the GGE (that is, G, genotype +GEI, genotypes-by- environment interaction) bi-plot method. The first two principal components (PC1 and PC2) were used to create a 2- dimensional GGE bi-plot and explained 59.67 and 13.48 % of GGE sum of squares, respectively. GGE bi- plot identified G16, G4, and G1 high yielders and stable and G34 and G25 was the lowest yielding and least stable across locations. On the other hand, the environment E6, E4 and E1 were the most suitable to select desirable genotypes.
},
 year = {2024}
}
TY  - JOUR
T1  - Performance Evaluation of Different Sorghum Genotypes (Sorghum bicolour (L.) Moench) Using GGE Bi-plot Stability Analysis

AU  - Nesrya Bedru
AU  - Temesgen Matiwos
AU  - Techale Birhan
AU  - Tegegn Belete
Y1  - 2024/05/17
PY  - 2024
N1  - https://doi.org/10.11648/j.ijgg.20241202.11
DO  - 10.11648/j.ijgg.20241202.11
T2  - International Journal of Genetics and Genomics
JF  - International Journal of Genetics and Genomics
JO  - International Journal of Genetics and Genomics
SP  - 19
EP  - 30
PB  - Science Publishing Group
SN  - 2376-7359
UR  - https://doi.org/10.11648/j.ijgg.20241202.11
AB  - Sorghum (Sorghum bicolor (L.) Moench) is an important essential cereal crop in Ethiopia. Conversely, its productivity is low due to numerous biotic and abiotic factors. There are diverse and dynamic environmental conditions which needs detail and continue study on genotypes by environment interaction (GEI) to develop stable genotypes. The objective of this study was to determine the magnitude of GEI for grain yield of forty two sorghum genotypes and to identify stable and high yielding genotypes across locations. The experiments were laid out at three locations for two growing seasons using alpha lattice design with three replications. The plot size 5 m x 0.75 m x 2 rows (7.5 m2) and distance between block, replication, and plot was 1m, 1.5m, and 0.75m, respectively. Phonologic, agronomic, diseases and grain yield data were collected but only grain yield was used for stability analysis. The ANOVA revealed highly significant variation (p th at E1,3rd at E3 and E4, 15th and 7th at E5 and E6 and maximum grain yield was harvested from E3. Yield data were also analyzed using the GGE (that is, G, genotype +GEI, genotypes-by- environment interaction) bi-plot method. The first two principal components (PC1 and PC2) were used to create a 2- dimensional GGE bi-plot and explained 59.67 and 13.48 % of GGE sum of squares, respectively. GGE bi- plot identified G16, G4, and G1 high yielders and stable and G34 and G25 was the lowest yielding and least stable across locations. On the other hand, the environment E6, E4 and E1 were the most suitable to select desirable genotypes.

VL  - 12
IS  - 2
ER  -
Jimma Agricultural Research Center, Ethiopian Institutes of Agricultural Research, Addis Ababa, Ethiopia
College of Agriculture and Veterinary Medicine, Jimma University, Jimma, Ethiopia
College of Agriculture and Veterinary Medicine, Jimma University, Jimma, Ethiopia
Jimma Agricultural Research Center, Ethiopian Institutes of Agricultural Research, Addis Ababa, Ethiopia
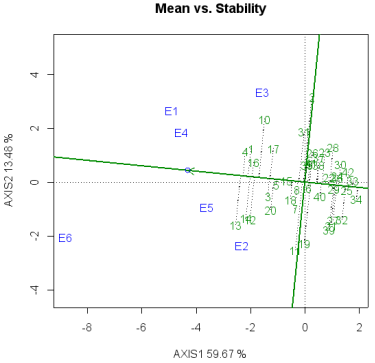
Figure 1. Average environment coordination (AEC) views of the based on environment-focused scaling for the mean grain yield performance and stability of 25 bread wheat genotypes tested across six environments. Details of environment are given in Table 1. Numbers 1 to 42 represent genotypes as indicated in Table 2.
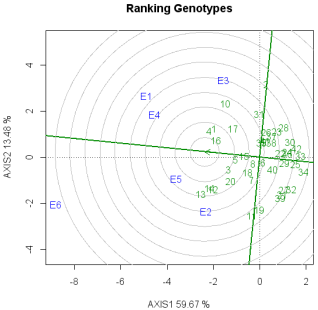
Figure 2. GGE biplot with scaling focused on genotypes, for the evaluation based on the ideal genotype of 25 bread wheat genotypes across six environments. Details of environment are given in Table 1. Numbers 1 to 42 represent genotypes as indicated in Table 2.
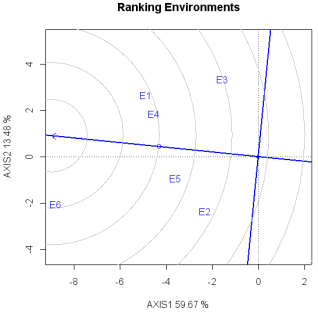
Figure 3. GGE biplot with scaling focused on environment, for the comparison of environments with ideal environment. Details of environment. Details of environment are given in Table 1. Numbers 1 to 42 represent genotypes as indicated in Table 2.
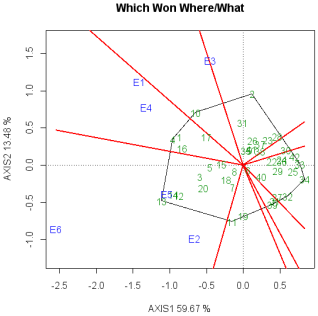
Figure 4. Polygon view of the GGE biplot using symmetrical scaling for the which-won-where pattern of the genotypes environments. Details of environment. Details of environment are given in Table 1. Numbers 1 to 42 represent genotypes as indicated in Table 2.